Explaining the Complex: Putting the Best Available Evidence Into the Hands of Decision Makers
Researchers are co-developing ways of ensuring scientific data and information is useable by the people who need it
We all know the basic concept of supply and demand in economics, which makes sense in most settings: the more demand for something, the more supply is needed to meet it. Put the spotlight on scientific research and the relationship between supply and demand becomes a bit skewed. The suppliers (researchers and scientists) are often completely disconnected from the demand side, which can consist of anyone from policy makers to farmers. This means that some of the best available science and evidence often never reaches the people who demand it and, if it does, it’s commonly in a format that is too complex to understand and therefore also often not useful as input into decision-making processes.
The problem is clear. Now how do we address it? This question guided our team of geospatial (clever mappers and modellers), soil (people who really know about the brown stuff in the ground) and decision scientists (who understand how we humans interact and negotiate) at the World Agroforestry Centre (ICRAF) in developing the Earth Observation Project for the International Fund for Agricultural Development (IFAD).
To boost our ‘supply’ suitcase, ICRAF partnered with the European Space Agency, which has allowed access to some of the best satellite images of the African continent, complementing data and information we collect in the field using a process known as the Land Degradation Surveillance Framework.
Data is collected from satellite images, ground surveys and mathematical models from lots of sites around the world to better understand the state of the land and how it changes over time. In Sub-Saharan Africa, this is important because over half of the labour force is dependent on farming for their livelihoods. Understanding the ‘health’ of the land is a critical piece of evidence for any donor, project manager or policy maker, and transferring that information in the right form to the primary users of the land: farmers.
In our case, the aim is to assist IFAD with their projects in East and Southern Africa by using our science on land health, combined with information on agricultural production and incomes, to ensure easy access and, more importantly, the skills and know-how to interpret data and evidence for planning, reporting and targeting where investments should be made.
So how can we convert scientific, detailed information into the most accessible form for decision makers? And who exactly are they? To address the ‘how’ we aim to make data easy to access and understand through the development of ‘dashboards’. These dashboards are co-developed with end-users and consist of a collection of multiple data sources and tools, where information can be accessed and visualized in a central location (usually online).
Developing data-access platforms has proven to be a popular and effective way of displaying data. Emerging data principles and data visualization forums stress the importance of designing for the user, ensuring ownership and sustainability. Taking into account these emerging guidelines and lessons, and using a stakeholder-engagement method developed by ICRAF’s SHARED decision hub, we have been working closely over the past six months with IFAD project teams, governments and partner organizations in Uganda and Kenya to develop customized dashboards. SHARED decision scientists introduce approaches often used in the world of marketing in this phase of the work to understand, ‘who is our end user, what do they want, and what catalyses change’?
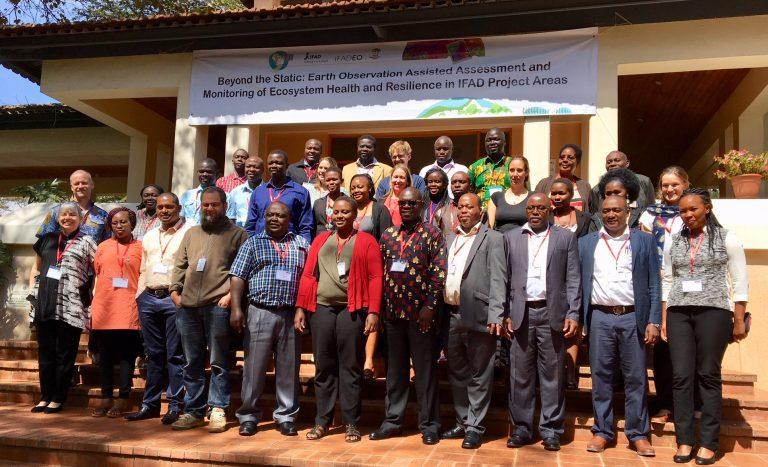
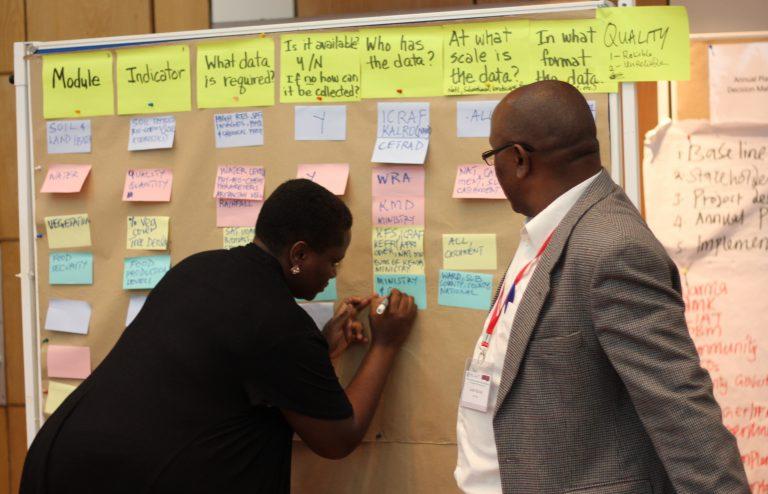
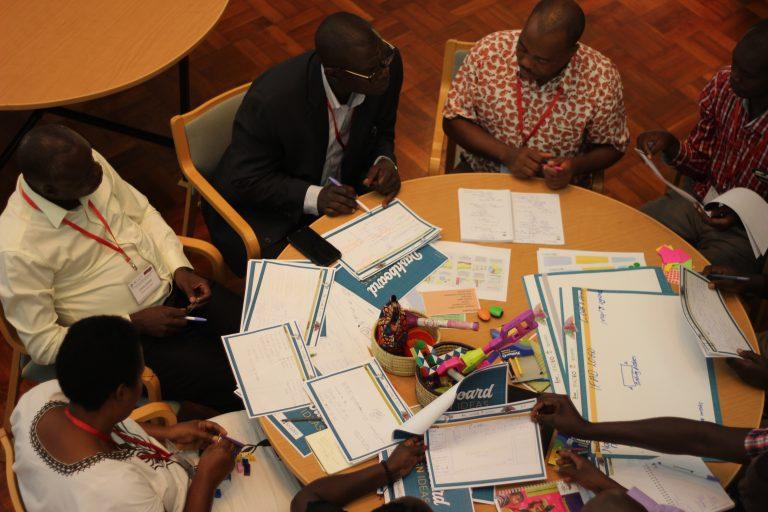
Engaging closely with IFAD’s country teams, we began the process of co-developing tools and dashboards for Uganda and Kenya with a ‘co-design’ training workshop at ICRAF’s Nairobi headquarters, 14–15 February 2018, in which 35 people representing IFAD projects in Uganda and Kenya participated.
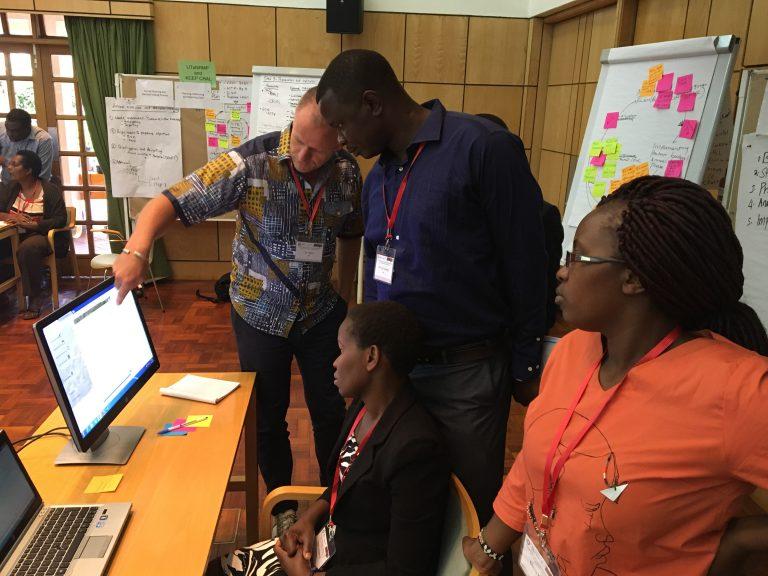
They were led through innovation sessions to discover their decision-making and planning cycles, to understand where data access and sharing could assist them in their current work and future planning, and the types of stakeholders they interact with.
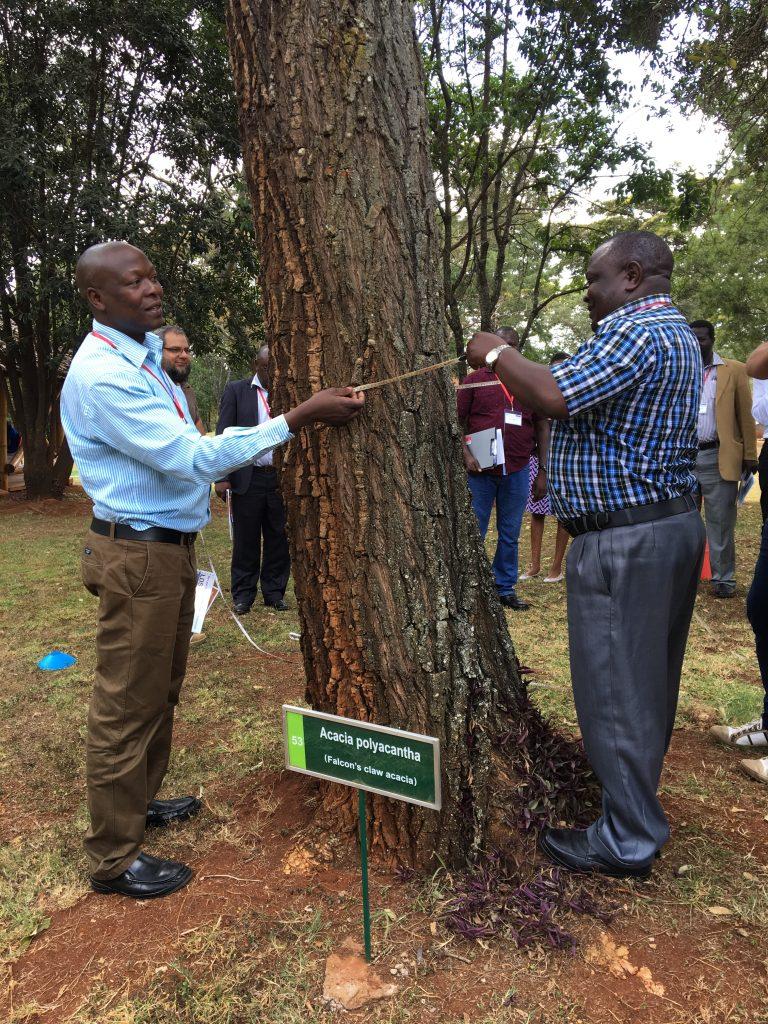
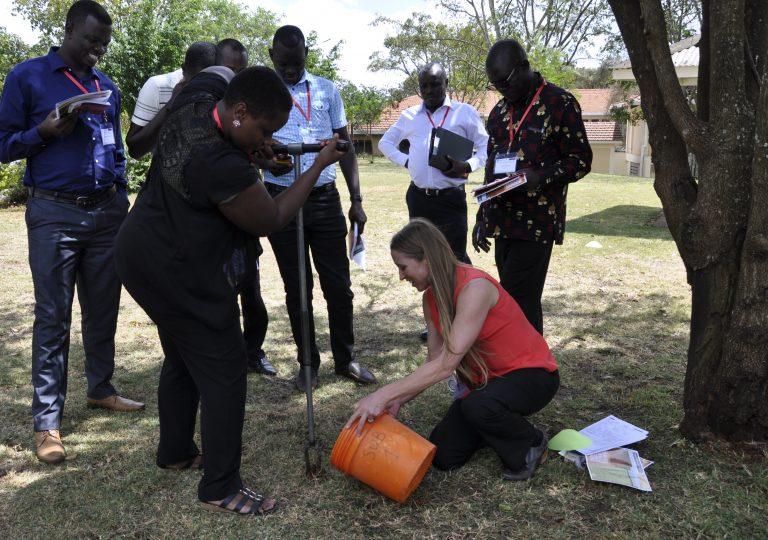
These planning sessions were complemented by a live demonstration in the field on how to collect information on soil and land health using established indicators. Participants were also introduced to IFAD’s approach to collecting information on socioeconomic data, such as education, poverty and income. Interactive sessions were held to explore existing data access dashboards developed by ICRAF.
We then facilitated a ‘design lab’ session to understand the potential and intended users. Imagining we were in a large IT company’s design lab working on the next mobile phone, participants rolled up their creative sleeves and were taken through a dashboard design session, identifying what kind of data-access system they wanted. Individual designs were presented to country teams to develop a dashboard that would best serve the projects.
This ‘co-design’ is something we are passionate about and proud of. Drawing on techniques, including user experience and interface designs from the outset of the project, intended end users are defining what they want and how they want to access it. We hope this will ensure that we can provide the best available science, including our niche in Earth observation satellite data and land health (soil and vegetation) information, into the hands of those who make decisions.
We all left the workshop feeling excited about the way forward, with a clear sense of what capacities we have to build and how we could communicate quickly and effectively as we create prototypes and build our country dashboards and data systems to readily support planning, monitoring and reflection.
Next month, we head to Southern Africa to meet our co-design teams from Lesotho and Swaziland. So, stay tuned for our next story where we reveal the first look and feel of our evolving dashboards and share key findings from both regions.
This blog was co-authored by Leigh Winowiecki, Constance Neely, Mieke Bourne and Tor-Gunnar Vagen.
The project, Beyond the Static – Operationalizing Earth Observation Assisted Frameworks for Assessment and Monitoring of Ecosystem Health in IFAD ASAP Project Areas, is funded by the International Fund for Agriculture Development (IFAD)

