Edison International 2021 Sustainability Report: Carbon Footprint
Edison International 2021 Sustainability Report
Our GHG emissions inventory covers Edison International, SCE and Edison Energy1. We account for GHG emissions using The Climate Registry’s General Reporting Protocol and the sector-specific reporting protocol for the Electric Power Sector. Edison International's and Edison Energy's emissions are de minimis compared to SCE's emissions.
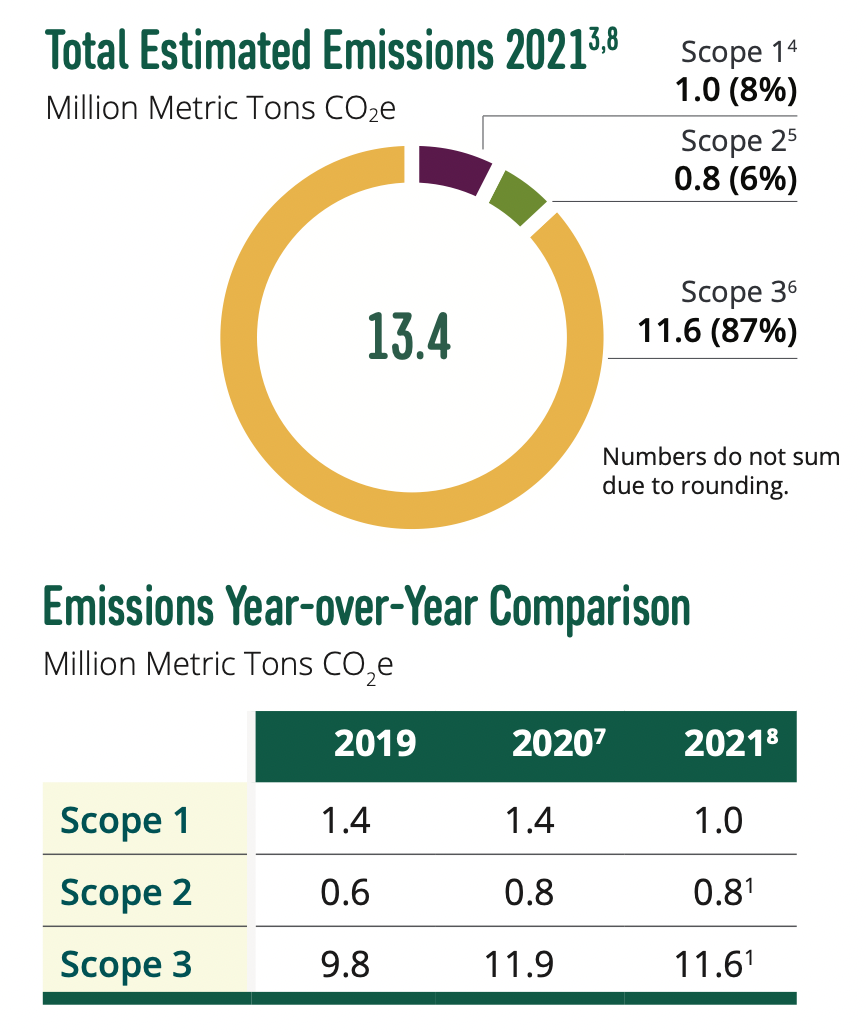
Scope 1 emissions represent an estimated 8% of our enterprisewide footprint. Scope 1 includes emissions from SCE's utility-owned generation, as well as emissions related to our transportation fleet, stationary combustion for backup generators and building heating, and fugitives such as sulfur hexafluoride (SF6). In 2021, 80% of Scope 1 emissions came from SCE’s combined cycle natural gas plant, Mountainview, which is covered under California’s cap-and-trade market. Our Scope 1 emissions declined an estimated 29% from 2020 due to Mountainview’s less frequent economic dispatch by the California Independent System Operator. The completion of SCE's West of Devers transmission line supporting higher levels of renewable energy and increased local capacity, as well as a planned outage of the plant to support capital work, contributed to this reduced run time.
Scope 2 emissions represent an estimated 6% of our footprint and include line loss emissions from power SCE purchases from third parties and sells to customers. Scope 2 also includes facility electricity, though this is a comparatively small portion of our footprint. Scope 2 emissions declined an estimated 4% from 2020. This appears to be due to normal operational variability associated with SCE’s purchased power mix. An update to SCE’s accounting of “retail sales” for its 2021 power mix may have also caused downward pressure on the line loss emissions estimate when compared to prior years. This is from an accounting perspective only.2
Scope 3 emissions comprise the majority of our footprint, an estimated 87%, and largely relate to the power SCE purchases from third parties and sells to customers. Our Scope 3 inventory includes, for the first time in 2021, an estimate of emissions from Edison International and SCE’s supply chain as it relates to goods and services, capital goods and upstream transportation and distribution.2 Our 2020 inventory has been updated to incorporate an estimate of these emissions as well. We continue to report our business travel and employee commute emissions in Scope 3 of our 2020 and 2021 inventories.
In 2021, our Scope 3 emissions declined 3% compared to 2020. The reduction appears to be predominantly due to normal operational variability associated with SCE’s purchased power mix. An update to SCE’s accounting of “retail sales” for its 2021 power mix may have also caused downward pressure on the estimated emissions when compared to prior years. This is from an accounting perspective only.1 We expect our Scope 3 emissions to decline substantially over the next two decades as Pathway 2045 is realized.
2021 Power Mix for SCE Customers
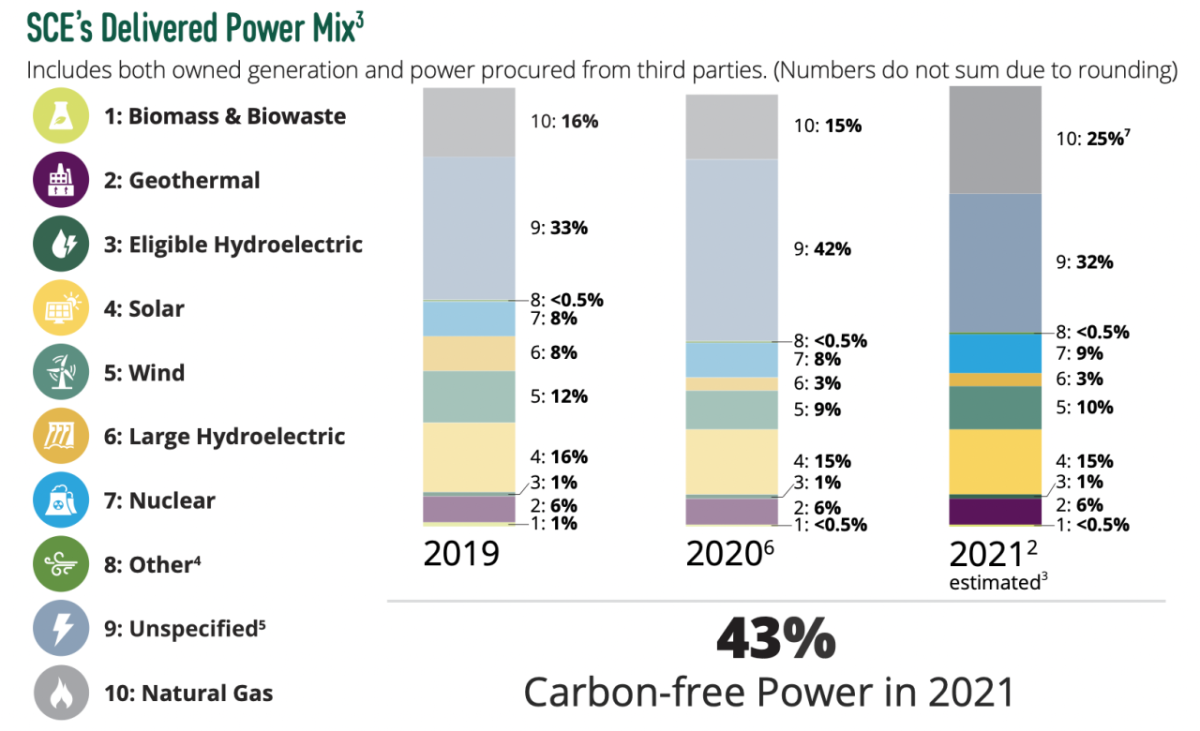
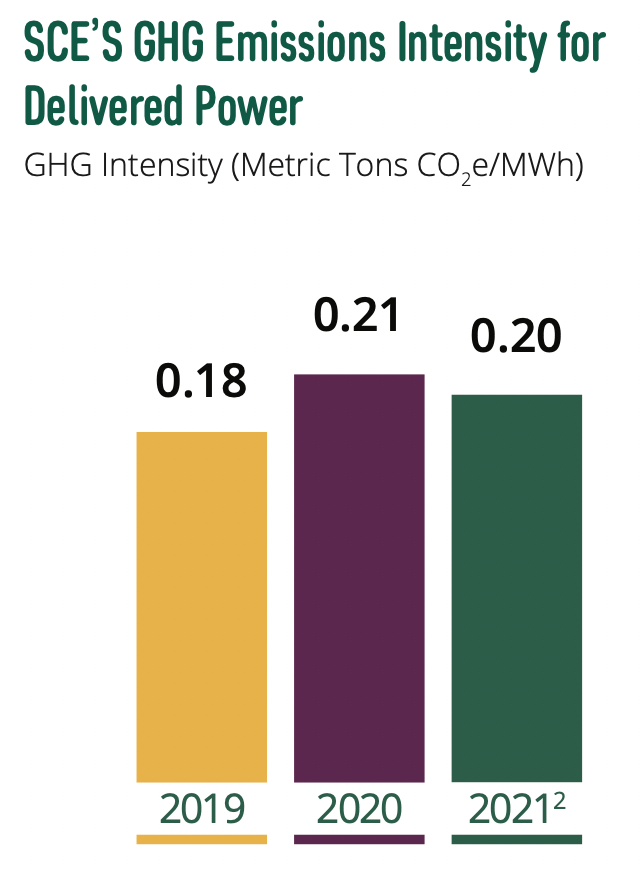
In 2021, 43% of the power SCE delivered to customers is estimated to have come from carbon-free sources, including RPS-eligible resources such as wind and solar, along with other carbon-free sources such as large hydroelectric and nuclear power. In 2021, SCE’s estimated delivered power mix emitted approximately 45% fewer GHG emissions per unit of electricity compared to the latest available U.S. national average.1
SCE's performance in terms of proportion of carbon-free power in its delivered power mix was similar between 2020 and 2021. SCE updated the methodology used to account for retail sales in 2021, to more accurately reflect load served and power purchased on behalf of and sold to SCE customers, however, which makes it difficult to compare year-over-year performance.2 We estimate that, under the old methodology, SCE's performance may have shown a slight percentage point decline compared to prior-year performance. This would be due to normal operational variability, and SCE remains well-positioned to meet our 2030 and 2045 RPS and carbon-free power goals and interim targets.
Path to Net Zero
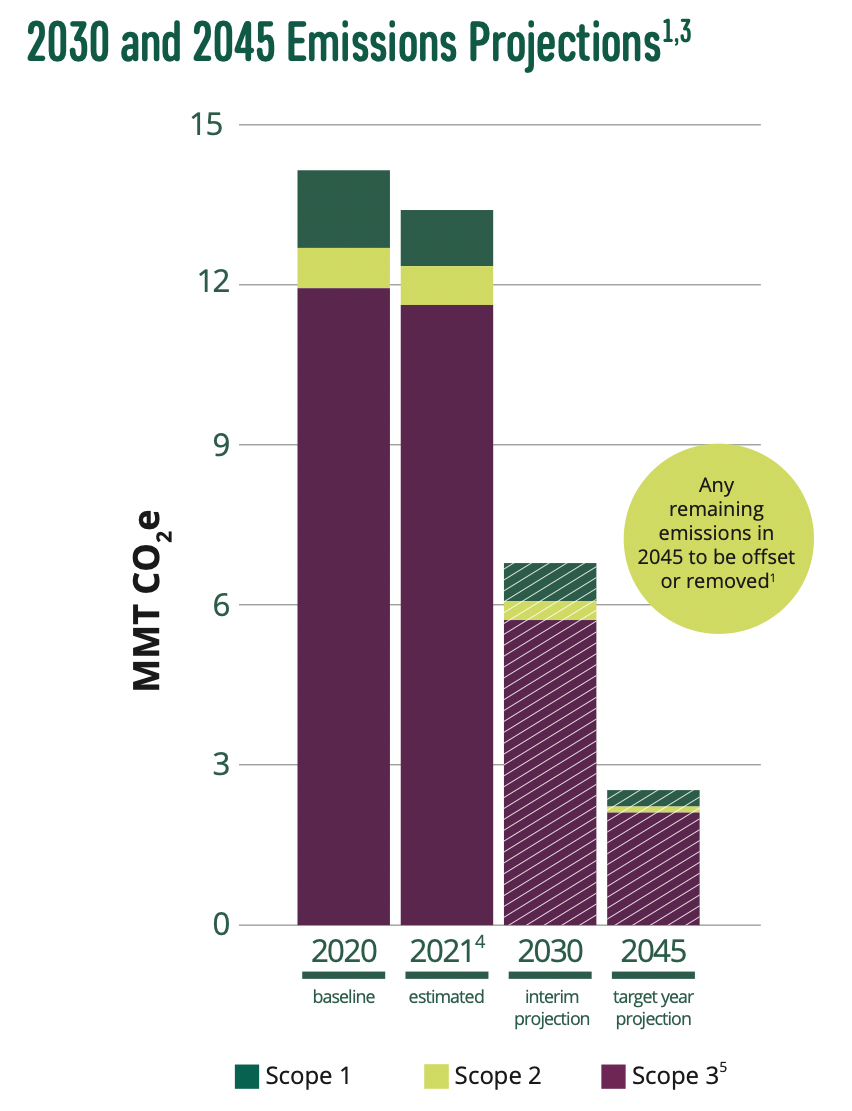
Edison International is committed to achieving net-zero GHG emissions across Scopes 1, 2 and 3 by 2045.1 GHG emissions stemming from the power SCE sells to customers comprise the majority (87% excluding line losses) of Edison International’s enterprisewide emissions inventory. Thus, a major component of our plan to achieve net-zero GHG emissions by 2045 is to deliver 100% carbon-free power to SCE customers by 2045. This goal is a statutory requirement in California and is supported by interim renewable energy compliance requirements through 2030. SCE has also set an interim carbon-free power target of 80% by 2030, which exceeds our renewable energy compliance requirement, and we have been advocating for the California Public Utilities Commission (CPUC) to authorize this target. SCE is investing heavily in energy storage and the grid-related capabilities needed to deliver high levels of intermittent renewable resources. We believe we can meet this carbon-free power target using technology that exists today.
SCE’s 100% carbon-free power target and California’s statutory requirement are both on a “retail sales” basis, which excludes, from an accounting perspective, power generation lost via transmission and distribution. This leaves a small amount of headroom for natural gas to serve as back-up power during high heat, peak load days or in case of emergency in 2045. This could come from SCE-owned natural gas resources (Scope 1) and/or power purchased from third-party generators (Scope 3). All electricity generators in California that emit over 25,000 MTCO2e annually are covered under the state’s cap-and-trade program, including SCE's Mountainview combined cycle plant. All other electricity generators are also included in California’s statewide GHG emissions inventory and thus any remaining emissions from natural gas power plants in 2045 will need to be offset or removed to meet the state’s economywide net-zero GHG emissions goal. Edison International is collaborating with peer utilities through LCRI to advance potential solutions.
We anticipate that the remaining 13% of emissions across our enterprise will decline substantially over the next two decades as California and other jurisdictions enact policies to meet economywide climate goals. Policies already enacted in California support electrification and decarbonization of our transportation fleet and facilities and the phase-out of SF6, a high global warming- potential gas, from SCE’s transmission and distribution equipment. In addition, we are exploring voluntary actions to accelerate the pace of change. SCE has set its own voluntary targets to electrify its transportation fleet and is exploring ways to engage its supply chain in decarbonization efforts.
Edison International and Edison Energy2 emissions are part of our enterprisewide commitment, and we plan to explore ways to reduce or otherwise offset this portion of our footprint. Edison International and Edison Energy emissions are considered de minimis compared to SCE emissions.
View the full 2021 Sustainability Report here.
1 Edison Energy is not the same company as Southern California Edison, the utility, and Edison Energy is not regulated by the California Public Utilities Commission.
2 In 2021, SCE updated its “retail sales” accounting to net out excess generation stemming from net-energy metering customers who generate power through rooftop solar and sell the excess back to the grid. This reduces SCE’s retail sales by approximately 3% and has the downstream effect of reducing, from an accounting perspective, the amount of “unspecified” energy SCE purchases on behalf of customers and those associated emissions. It also increases, from an accounting perspective, the proportion of specified resources, such as RPS-eligible energy, in SCE’s retail sales. This updated approach more accurately reflects the load served and power purchased on behalf of and sold to SCE customers. Prior year emissions metrics have not been updated, however, and thus a year-over-year comparison is not feasible for Scope 2 and Scope 3 emissions.
2 Edison International and SCE supply chain emissions have been estimated using the spend-based method, which multiplies the economic value of goods and services purchases by average emissions factors for each relevant industry. The estimates are 0.7 MMT CO2e and 0.9 MMT CO2e for 2020 and 2021, respectively.
3 Inventory excludes certain miniscule sources, such as refrigerants related to air conditioning systems that are too small to be captured in SCE’s air quality compliance reporting or emissions from certain specialized vehicle rentals, which we estimate to be miniscule and permitted for exclusion pursuant to The Climate Registry’s GHG emissions reporting protocols.
4 Scope 1 emissions are direct emissions under the control of the company, including utility-owned generation (89%), stationary and mobile combustion (<1% and 7%, respectively) and fugitives, such as SF6 from transmission and distribution (T&D) operations (4%).
5 Scope 2 emissions are indirect emissions required for business processes, including average market-based and location-based facility electricity (<5%) and T&D line losses (96%).
6 Scope 3 emissions are realized as a consequence of our activities, including specified and unspecified power purchases to serve SCE customers (92%), Edison International and SCE's supply chain (8%), and enterprisewide employee commuting and business travel (<1%). Our Scope 3 emissions inventory continues to evolve with the new addition of emissions from Edison International and SCE's supply chain, as well as Edison Energy's9 business travel and employee commuting.
7 Scope 1, 2, and 3 emissions for 2020 have been updated from 1.5 MMT CO2e to 1.4 MMT CO2e, 0.7 MMT CO2e to 0.8 MMT CO2e and 11.3 MMT CO2e to 11.9 MMT CO2e, respectively, to reflect final purchased power data from SCE's 2020 Power Source Disclosure Program (PSDP) filing, which was finalized and submitted after the preparation of the 2020 Sustainability Report, as well as use of other refined data inputs in the inventory. 2020 Scope 3 emissionscalculation update also includes the addition of emissions from Edison International and SCE’s supply chain2, as well as Edison Energy’s9 business travel and employee commuting (Edison International and SCE’s business travel and employee commuting were previously included). The 2020 figures for Scope 1 and 2 also now included Edison Energy's emissions.
8 Emissions calculations for 2021 are estimated and include as an input an estimate of SCE's 2021 delivered power mix using the methodology prescribed by the California Energy Commission's (CEC) PSDP as of April 2, 2022.SCE’s final PSDP report will be filed with the CEC on June 1, 2022, and may include updates to the inputs used in these calculations. The proportion of line loss compared to delivered power in 2021 has also been estimated using 2020 as a proxy.
9 Edison Energy is not the same company as Southern California Edison, the utility, and Edison Energy is not regulated by the California Public Utilities Commission.
1 U.S. national average available through the Environmental Protection Agency (EPA) Emissions and Generation Resource Integrated Database (eGRID) for data year 2020 is 822.6 lbs. CO2e/MWh or 0.37 MT CO2e/MWh.
2 In 2021, SCE updated its “retail sales” accounting to net out excess generation stemming from net-energy metering customers who generate power through rooftop solar and sell the excess back to the grid. This reduces SCE’s retail sales by approximately 3% and has the downstream effect of reducing, from an accounting perspective, the amount of “unspecified” energy SCE purchases on behalf of customers and those associated emissions. It also increases, from an accounting perspective, the proportion of specified resources, such as RPS-eligible energy, in SCE’s retail sales. This updated approach more accurately reflects the load served and power purchased on behalf of and sold to SCE customers. Prior year power mix and emissions metrics have not been updated, however, and a year-over-year comparison is not feasible.
3 This is an estimate of SCE’s 2021 delivered power mix using the methodology prescribed by the CEC's PSDP as of April 2, 2022. SCE’s final PSDP report will be filed with the CEC on June 1, 2022 and may include data that differs from the estimate shown here to reflect subsequent changes or clarifications to PSDP's methodology and reporting template. Numbers do not sum due to rounding.
4 "Other" consists of diesel and liquefied petroleum gas from SCE-owned Pebbly Beach Generating Station on Catalina Island.
5 Unspecified power refers to electricity that is not traceable to a specific generating facility, such as electricity traded through open market transactions administered by the California Independent System Operator (CAISO). The power is typically a mix of resources, largely dominated by natural gas and renewables. The generating resources in the CAISO market are getting cleaner as more renewables are added to the grid in line with California state law. Unspecified power also consists of energy from out-of-state wind projects that are not delivered into California. This energy is considered RPS-eligible for RPS compliance purposes, however. See Delivered Power Mix & GHGEmissions: Additional Information.
6 2020 delivered power mix data reflects final data from SCE’s PSDP filing in June 2021, and has been updated from the estimate shown in the 2020 Sustainability Report. Update includes natural gas updated from 16% to 15%.
7 The proportion of natural gas in SCE’s delivered power mix increased in 2021 compared to 2020 due to the addition of two tolling agreements with third-party natural gas generators. The addition of these agreements, which also resulted in a decrease in SCE's procurement of market-based, unspecified energy, was done as a normal course of business to optimize SCE’s portfolio to meet reliability, cost and renewable energy compliance objectives.
1 Meeting this net-zero goal is contingent on approvals from SCE's regulators, as well as the availability of viable technologies in 2045 to adequately offset or remove remaining carbon from our enterprisewide footprint.
2 Edison Energy is not the same company as Southern California Edison, the utility, and Edison Energy is not regulated by the California Public Utilities Commission.
3 This chart shows a projection of Edison International's enterprisewide emissions in 2030 and 2045 based on assumptions aligned with SCE's Pathway 2045 white paper. Factors that could impact the emissions estimates include, among others, fluctuations in SCE-bundled load due to community choice aggregation formation in SCE's service area and uptake of electric technologies, variability in economic dispatch of Mountainview and SCE's other gas generation resources for system reliability purposes, and the availability of new technologies and innovation that affect emissions.
4 The 2021 emissions inventory is an estimate. It also includes as an input “retail sales,” which was calculated using a different methodology in 2021 compared to prior years. Please see footnotes on p. 14 for more details.
5 Edison International’s Scope 3 emissions reporting continues to evolve. In 2020 and 2021 it included the following emissions sources: specified and unspecified power purchases to serve SCE customers, an estimate of Edison International and SCE's supply chain, and enterprisewide employee commuting and business travel. Other Scope 3 emissions categories may be relevant to Edison International and this commitment that are not included here.


